Saturday, July 09, 2016

Progress Towards Mammalian Whole-Brain Cellular Connectomics

From the Intro:
Since its inception, neuroscience has attempted to interpret brain organization and function without a detailed map of its total neuronal constituents and their complete inter-connectivities at the required synaptic resolution. Without such a map, a whole-brain cellular connectome, it is highly improbable that the precise neural computations underlying brain and behavior will ever be adequately understood.

Read the full article here


Friday, April 17, 2015

High-resolution whole-brain staining for electron microscopic circuit reconstruction

An improved method for preparing mouse brains for electron microscopy allows reliable tracing of neurites and identification of synapses and appears suitable for whole-brain connectomic reconstruction.


Full article at Nature Methods

Sunday, February 15, 2009

Connectomics Segmentation & Circuit Reconstruction Challenge

from connectomes.org :

The Challenge:
Download the images at http://brainmaps.org/index.php?action=viewslides&datid=137 which are SBF-SEM images from mouse hippocampus, and try your best algorithms and software for segmentation and circuit reconstruction. These are important problems to solve because much larger datasets of this type will soon be available as part of the connectomics initiative to map entire brains at synapse resolution.

Labels: , ,

Tuesday, July 10, 2007

The Brain Maps API


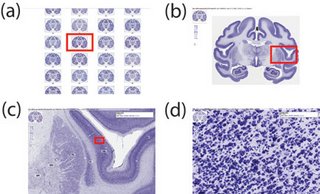
BrainMaps.org has recently implemented a new AJAX-enabled multiresolution image viewer. Though a bit skimpy on functionality compared to the heavy-weight Flash viewers, it is snappy fast, uses very little memory, and in principle, allows for better integration with other HTML entities through DOM. An example is at http://brainmaps.org/ajax-viewer.php?datid=95&sname=123

What's more, the multiresolution viewer has been released as the Brain Maps API. The following is from the Brain Maps API page:

"The Brain Maps API lets you embed Brain Maps in your own web pages with JavaScript. Future versions will enable you to add overlays to brain maps (including markers and polylines) and display shadowed "info windows". The Brain Maps API is a free service, available for any web site that is free to consumers."

An example of the new Brain Maps AJAX GUI, which is a more beefed-up version of the Brain Maps API, is shown below:

Try going to this link to see what all the fuss is about, and once there, try clicking and dragging the image, or clicking on the little tree icon in the upper right. Also, the mouse scroll wheel should zoom you in and out.

Google Maps for the Brain? Not quite yet. It still needs image overlays and labels. But that being said, it's the best I've seen yet.

Labels: ,

Sunday, May 20, 2007

Is the Brain a Spintronic Device?

Spintronics is a new paradigm of electronics based on the spin degree of freedom of the electron. Either adding the spin degree of freedom to conventional charge-based electronic devices or using the spin alone has the potential advantages of nonvolatility, increased data processing speed, decreased electric power consumption, and increased integration densities compared with conventional semiconductor devices.

All spintronic devices act according to the simple scheme: (1) information is stored (written) into spins as a particular spin orientation (up or down), (2) the spins, being attached to mobile electrons, carry the information along a wire, and (3) the information is read at a terminal. Spin orientation of conduction electrons survives for a relatively long time (nanoseconds, compared to tens of femtoseconds during which electron momentum decays), which makes spintronic devices particularly attractive for memory storage and magnetic sensors applications, and, potentially for quantum computing where electron spin would represent a bit (called qubit) of information.

Given the incredible intricacies of the brain's ultrastructure and the billions of years it has had to evolve, it is conceivable that the brain may utilize spintronics. Of course, any talk of quantum mechanical effects in the brain is often greeted with scepticism, thanks to the shameless shenanigans of Roger Penrose and Stuart Hameroff involving Bose-Einstein condensates and microtubules. However, there may be a role for quantum mechanical effects in neural computation yet. The 'brain as spintronic device' idea is speculative, but perhaps worth further consideration, bearing in mind that one potential problem with spintronics is whether spin states are stable long enough to be used in neural computation.

Labels: , ,

Saturday, March 17, 2007

Another Neural Prediction Challenge!

In a previous post, I noted that Jack Gallant had issued a Neural Prediction Challenge. Now, we have another challenge, this time from the Gerstner lab:

Here is our Challenge, open to everybody in in neural modeling, machine learning, or similar fields:

- Is it possible to predict the timing
of every spike that a neuron emits with 2 ms precision?
- Is it possible to predict the subthreshold membrane potential
with a precision of 2 mV for arbitrary input?

Annotated training data and test stimuli from several
cells under different stimulation conditions are available
at
http://icwww.epfl.ch/~gerstner/QuantNeuronMod2007/challenge.html

Important dates
* Data set available by March 16.
* Participants must submit their prediction by June 1st.
* Winner announced around June 10 .
* Winning results will be presented at the workshop June 25/26
Quantitative Neuron Modeling: Predicting every spike?
http://icwww.epfl.ch/~gerstner/QuantNeuronMod2007/

Competition and Prizes
The competition is organized in several categories, called A,B,C,D.
Participants may run in one or several categories

* 1st prize :

o 4 nights of hotel in Lausanne at the Lake of Geneva,
June 23-27.
o Free participation in the Quantitative Neuron Modeling
workshop June 25/26
o 35-minute-slot for talk as an
Invited Speaker at the workshop.

* 2nd prize:

o Free participation in the
Quantitative Neuron Modeling workshop June 25/26
o Poster presentation and poster spotlight in the workshop.


Methods and Models:
The only aspect that counts for us is the quality of the prediction
on the test set. In terms of methods, anything goes
(Machine learning, compartmental model, integrate-and-fire model,
systems identification etc)

For details
http://icwww.epfl.ch/~gerstner/QuantNeuronMod2007/challenge.html


We hope that many people will take up the challenge.
Let the best model win!

Labels: , , , ,

Saturday, February 24, 2007

Synapse Resolution Whole-Brain Atlases


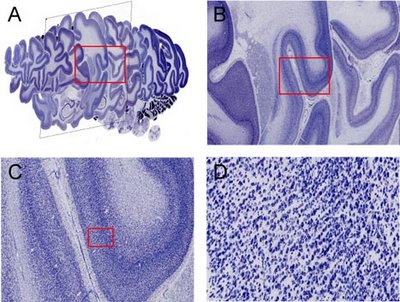
It is well-known that the highest resolution whole brain atlases are currently at BrainMaps.org, which has been compared to a Google Maps for the brain. However, these atlases are 0.46 microns per pixel, and are not sufficient to discern individual synapses, which require nanometer resolution. So in this post, I will consider the problems associated with constructing a synapse resolution (nanometer resolution) whole-brain atlas.

There seem to be two fundamental hurdles to constructing a synapse resolution whole-brain atlas: 1) image acquisition, and 2) digital technologies for working with the images and serving them over a network.

The first hurdle encompasses the time bottleneck and section preparation. If each section is 50 nm thick, then for a 10 mm mouse brain, 200,000 sections are needed, thus requiring some type of automation for section preparation. If we consider the time to scan a single 10mmx10mm section at 10nm pixel size at 1MHz, it comes out to 12 days (additional overheads would come from stage movements). Even with 200,000 TEMs (transmission electron microscopes) in parallel, one for each section, it will take 12 days for the complete scan. An alternative is offered by way of virtual microscopy solutions offered for light microscopy. One way would be to scan over the section, acquiring one column at a time instead of a patchwork of small images for montaging. Another alternative would be to construct a TEM with parallel scanning capabilities (having parallel magnetic lenses and electron beams), so that the entire section could be scanned at once, instead of scanning each little image patch in serial. This solution requires constructing a special type of TEM which implements certain features found in current day virtual microscopy systems for LM (light microscopy), and thus requires a team of hardware and software specialists to specially design, in addition to some physicists who are intimately acquianted with the physics behind TEM.

The second hurdle involves digital technologies, and the observation that even if a whole mouse brain was able to be acquired through TEM, that digital technologies currently would not be able to deal with that much data (200 PB, uncompressed). A single section is 1 x 10^12 pixels, which comes out to 1 TB (uncompressed, 8 bit grayscale), which is still not feasible using today's digital technologies.

In conclusion, for purposes of obtaining information about whole-brain connectivity, a nanometer-resolution whole-brain scan is required, and current-day tracer experiments are suboptimal and will always leave room for ambiguities that can only be resolved by completely mapping every synapse and axon in the brain. However, constructing a synapse resolution (or nanometer resolution) whole-brain atlas for even a mouse brain is so formidable as to be seemingly beyond today's technological capabilities. Maybe in 10-20 years.

Labels: , , , , ,

Wednesday, February 07, 2007

Pubmed Pet Peeves

Suggestions for the Pubmed developers:

1) Assign a unique author ID so that you can pull up all publications for a given individual as opposed to all individuals who happen to have the same name.

2) Ability to export references to Bibtex format. (Google Scholar does this already).

3) Include number of times cited. (Google Scholar does this also).

Wednesday, January 24, 2007

What is a Brain Area?

What is a "brain area"? More recently, I have become aware of the inadequateness of the concept of "brain area", or at any rate, to call into question the basis for such a concept. This basis is three-fold, as noted by Felleman/van Essen: cortical areas (or in general, brain areas) are defined by 1) connectivity, 2) functional maps, and 3) chemical or architectonic signatures. However, for the most part, parcellations of the primate (and non-primate) brain have been based on studies using Nissl- or myelin-stained material that are over a century old, and investigators have come up with widely different parcellation schemes for the brain, which in my opinion, is a prominent warning sign that the notion of "cortical area" is ill-defined. Further anatomical studies of the brain have confirmed this point to me. And so, while I recognize the utility to conventionally naming different brain areas on the basis of Nissl-stained material or otherwise, I do not believe we currently possess an adequate conceptual understanding of what really constitutes a "brain area". In early sensori-motor areas, this concept seems applicable since we are talking about mappings from sensory receptor sheets onto the cortex, which get mapped onto well-defined areas of the brain, but other areas of the brain are not like this, and there is no reason a priori to expect that these association and limbic parts of the brain should be nicely parcellated into anything like discrete non-overlapping brain areas.

Part of the problem involves considering useful alteratives to this notion of discrete non-overlapping brain areas which is prevalent in the neuroscience community, and which heavily biases interpretions of experiments. It is largely a conceptual problem, but I am confident that a revolution in our notion of "brain area" will be forthcoming in the near future. Such an overhaul in this precious concept is requisite to a better understanding of the brain.

What I find amusing is that neuroscience textbooks never address this conceptual issue, though it is widely recognized by many prominent neuroscientists as a central problem. This has the peculiar effect that students of neuroscience often learn about their subject, thinking that all of the fundamental conceptual issues have been worked out and that the field of neuroscience rests on a firm foundation. This is not the case, and I would not be surprised if this shaky foundation crumbles, and that many of the "mysteries" of the brain's organization and function, when viewed in a new light and a new foundation, do not seem that mysterious after all, but rather obey a very precise and well-defined logic and reason.

The observation that the concept of "brain area" is ill-defined means, in part, that current attempts to analyze whole-brain connectivity using graph theory are based on incorrect data and incorrect assumptions, since we may legitimately question whether the nodes in the graph have any real meaning. So claims like "the brain is a small-world network" purported by some are empty, and are merely the consequence of following the recent fad in "network science", where anyone and everyone attempts to show that their favorite system is a so-called small-world network. How unoriginal and blase! If only these people could think for themselves instead of parroting the latest fad. The worst part of it is when these people actually publish such nonsense since it misleads other people (usually laymen, but also some neuroscientists) who don't know any better.

Tuesday, November 21, 2006

Neural Prediction Challenge

The gauntlet has been thrown. Accept the Neural Prediction Challenge if you dare!

The challenge is really quite simple: We will give you some (visual and/or auditory) stimuli and corresponding neural responses, and you must try to predict responses to other stimuli. Each data set will be divided in to two subsets: a fit set (90% of the data) that includes both the stimuli and the corresponding neuronal responses; and a validation set (10% of the data) that includes only stimuli (no responses). Your job is to use the fit set to fit your model and then to generate predicted responses based on the stimuli provided in the validation set. Once you have the predictions you should return them to us. We will compare your predicted responses to the responses actually observed in the validation set.


Kudos to Jack Gallant and other people responsible for coming up with this idea, collecting and sharing data, and putting together the site.

Labels: , , , ,

Tuesday, October 24, 2006

Journal Spam

I have a new term for describing excessive journal articles published by an individual that all contain the same or similar crap content: "journal spam". It seems particularly apt for describing a lot of the articles I've come across by certain individuals (whose names will be withheld as a professional courtesy). I find myself asking, why do these people waste their time publishing the same crap over and over? Some are editors of journals, so this may play a role. However, there must be some other motive at work here. No doubt vanity plays a big role. It's unfortunate that the noble pursuit of truth is for many people degraded to a mere vanity show. It annoys me somewhat because, just like regular (unfiltered) email spam, I need to wad through it to get to real content....

Saturday, October 21, 2006

Society for Neuroscience Conference 2006

The Society for Neuroscience Conference was held this year in Atlanta, GA, from Oct 14-18, 2006. Here are a few thoughts of my experiences there.

Atlanta was an ideal venue and is one of the cleanest cities I've been in. There was literally no litter throughout the downtown area. There are also many fountains, statues and other niceties throughout the city that serve to differentiate it from your typical lot.

The conference center was very large. Fortunately, the Society for Neuroscience organizers had the sense to organize most activities within a circumscribed region of the conference center, with the exception of a few minisymposia which for some reason were located on the opposite side of the conference center and required a 2 mile trek to reach.

The "Dialogues Between Neuroscience and Society" talk, which last year featured the Dali Lama, this year featured architect, Frank Gehry. On the plus side, some interesting slides of the guy's architectural designs were displayed, but this did not make up for his poor execution in delivering his talk. It was like he didn't even prepare for it. And to top it off, there was no mention of neuroscience during his talk. I found myself, halfway through his talk, wondering why I was sitting in on an architecture talk at a neuroscience conference. Needless to say, I was very disappointed with Frank Gehry's talk, though some of his architectural designs were intriguing and memorable.

One of the things I despise about browsing the posters is the blatant desperation of some of the poster presenters. It's like some of them are waiting to trap you, desperate for attention. Oftentimes, I'm not influenced by these ploys, but on occasion, permit myself to indulge and to listen through a poster presentation that is reminiscint of a used car salesman's pitch. Please poster presenters, try to maintain your dignity! You know who you are.

I attended quite a few minisymposia and slide shows. Most notable were ones over brain-machine interfaces, theoretical neuroscience, and object coding in the visual system. Some will remember me from these minisymposia as the one who asked many questions, often critically. Speakers, beware. I have little patience for nonsense and run arounds. As for those speakers who can't speak comprehensible english and yet feel compelled to deliver talks at an english-speaking conference should take note that no-one understood their talks; hence the lack of questions following their talks.

Overall, the Society for Neuroscience Conference 2006 was one of the best yet. There were over 30,000 attendees, but so long as you focus on what interests you, then you shouldn't get overwhelmed by it all and still have energy to enjoy the city nightlife and make new friends and other contacts.

This is my 7th or 8th Society for Neuroscience Conference I've attended and presented at. What I find remarkable are all the new faces, even after many years of attending these things; I still recognize less than 2% of the faces I see (and probably closer to 1%), but given that there were 30,000 attendees, this works out to 300-600 people. I have noticed similar content in posters and talks year after year, with rare flashes of genuinely creative and brilliant work. It's these rare flashes of brilliance that make these conferences really worthwhile. Yes, the social aspect is great, but finding that rare cutting-edge flash of brilliant work that sheds (or is possible of shedding) new light on brain function and organization is greater. After all, we are all here to understand the brain, which is the equivalent of Know thy Self.

Thursday, September 14, 2006

Google Earth for the Brain


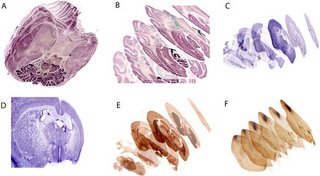
If BrainMaps.org is like Google Maps for the Brain, StackVis is Google Earth for the Brain. Welcome to StackVis, a 3D viewer of neuroanatomical sections.


Google Earth for the BrainFigure Caption. The development of additional desktop application tools for interacting with brainmaps.org image and database data includes the one shown here, StackVis, which is a 3D viewer of neuroanatomical virtual slide image stacks that is integrated with high resolution viewing of and interaction with individual sections comprising the image stack. (A) horizontal image stack of nissls of the macaque brain viewed from below. (B) same image stack as in (A) but from a different perspective, with increased inter-section spacing, and with areal and nuclear labels. (C) coronal image stack of nissls of the mouse brain. (D) a section from (C) viewed at higher resolution. (E) coronal image stack of acetylcholinesterase reacted sections of the mouse brain. (F) sagittal image stack of the mouse brain reacted for biotinylated dextran amine (BDA) following an injection in frontal cortex. Note that labeled fibers can be followed within the image stack due to section transparency and that individually labeled subcortical structures can be discerned, allowing for an assessment of labeled fiber pathways and areas within a 3D framework. In addition, StackVis features automated section registration and edge detection capabilities.

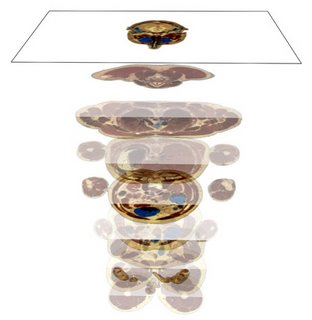
Figure Caption. Viewing the Visible Male using StackVis. The sections are axial, and are arranged in this figure so that the brain is located at the top and the legs are located at the bottom of the image stack.

Labels: , , ,

Sunday, August 27, 2006

Universe as Neural Net?


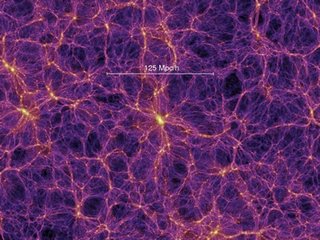
Does the large-scale structure of the universe resemble a big neural net? Yes, I know it sounds somewhat ridiculous, but I couldn't help making the association when I saw these pictures of the large-scale structure of the universe. What would be the implications of a universe-wide intelligence made explicit in the large-scale structure of the universe and its interactions?!

Ok, I'm being somewhat tongue-in-cheek here, but the reticular large-scale structure of the universe does bear striking similarities to the reticular organization of the nervous system.


Project Description:
The Virgo consortium, an international group of astrophysicists from the UK, Germany, Japan, Canada and the USA released in June 02, 2005 the first results from the largest and most realistic simulation ever of the growth of cosmic structure and the formation of galaxies and quasars. In a paper published in Nature, the Virgo Consortium showed how comparing such simulated data to large observational surveys can reveal the physical processes underlying the build-up of real galaxies and black holes.

The "Millennium Simulation" employed more than 10 billion particles of matter to trace the evolution of the matter distribution in a cubic region of the Universe over 2 billion light-years on a side, in the largest ever model of the Universe. It kept the principal supercomputer at the Max Planck Society's Supercomputing Centre in Garching, Germany occupied for more than a month. By applying sophisticated modelling techniques to the 25 Terabytes (25 million Megabytes) of stored output, Virgo scientists are able to recreate evolutionary histories for the approximately 20 million galaxies, which populate this enormous volume, and for the supermassive black holes occasionally seen as quasars at their hearts.

"It is the biggest thing we have ever done," said Carlos Frenk of the University of Durham. "It is probably the biggest thing ever in computational physics. For the first time we have a replica universe which looks just like the real one. So we can now for the first time begin to experiment with the universe.

Thursday, August 24, 2006

Virtual Microscopy a Disruptive Technology?

Virtual microscopy is a method of posting microscope images on, and transmitting them over, computer networks. This allows independent viewing of images by large numbers of people in diverse locations.

Prior to recent advances in virtual microscopy, slides were commonly digitized by various forms of film scanner and image resolutions rarely exceeded 5000 dpi. Nowadays, it is possible to achieve more than 100,000 dpi and thus resolutions approaching that visible under the optical microscope. This increase in scanning resolution comes at a price; whereas a typical flatbed or film scanner ranges in cost from $200 to $600, a 100,000 dpi slide scanner will range from $80,000 to $200,000.

Virtual microscopy has been characterized as potentially a disruptive technology. A disruptive technology is a new technological innovation, product, or service that eventually overturns the existing dominant technology in the market, which in this case would be real (i.e., conventional) microscopy. Our experience with virtual microscopy suggests that it is unlikely to replace real microscopy any time soon, but for the time being, it nicely complements and extends the capabilities of real microscopes. Specifically, we find a three-fold extension of virtual microscopy over real microscopy in the following areas: 1) data-sharing and remote access, 2) data-management and annotation, and 3) data-mining. Data management and data-mining of virtual (digitized) slides are capabilities that cannot be directly applied to real slides. In addition, the online distribution and sharing of virtual slides with anyone with an internet connection ensures the rapid dissemination of neuroanatomical data that otherwise would not be possible. While largely emphasizing the pros of virtual slides in this article, it is worthwhile to point out the cons. Namely, it is not possible to change focus in a virtual slide as it is in a real slide. Normally, this is not a problem since virtual slides tend to be completely in focus. However, the inability to change the plane of focus in a virtual slide rules out their use in unbiased stereological estimation methods that require optical dissectors. Nonetheless, biased sterelogical estimation methods, or unbiased methods not using optical dissectors, are still possible. Another drawback is that the resolution of the virtual slide is limited to the optical lens used in the scanner. For example, if we generate a virtual slide at 20x and subsequently want to examine part of the slide at 40x, then it is necessary to rescan the entire slide using the higher objective, which in some cases, is not possible due to file size restrictions or hardware issues. Finally, at the time of writing, virtual microscopy does not deal well with fluorescence, and is only recommended for light microscopy.

Virtual microscopy-based digital brain atlases are superior to conventional print atlases in five respects: 1) resolution, 2) annotation, 3) interaction, 4) data integration, and 5) data-mining. The resolution of conventional print brain atlases typically does not exceed 7200 dpi, whereas virtual microscopy-based digital brain atlases attain 100,000 dpi and offer the ability to zoom in and out. Annotation can be more complete in virtual microscopy-based digital brain atlases, with options to display some types of annotations and make the rest invisible. Greater interactivity means that the user can zoom in/out and pan through brain image data, which is not possible in print-based atlases. Data-integration capabilities, including the integration of connectivity and gene expression data, are superior for the virtual microscopy-based digital brain atlases. And finally, the ability to data-mine virtual microscopy-based digital brain atlases is a feature not available for print-based atlases. While we do not foresee virtual microscopy-based digital brain atlases completely replacing conventional print-based brain atlases, we expect that they will be progressively more commonly used in place of print-based atlases.

What I'd like to know is, how likely is virtual microscopy to overtake regular microscopy and print atlases in the near future? In my opinion, conventional print brain atlases are a ripoff, often costing over $200 each. The idea of having this information freely available online is very tantalizing and welcome.

In other news, Society for Neuroscience 2006 is fast approaching! Hope to see you all in Atlanta this Oct 14-18.

Labels: , ,

Saturday, July 29, 2006

Visualization of Whole-Brain Connectivity

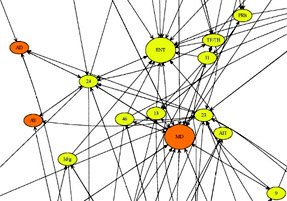
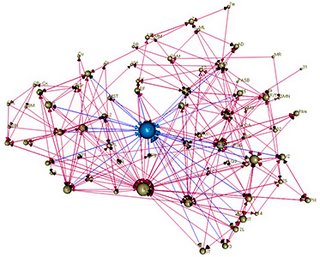
Growing up in the internet age, most of us are very familiar with network diagrams of all sorts. Indeed, this is also the age of the network. But surprisingly, while there are diagrams for almost every type of network you can conceive of, there is a remarkable lack of such diagrams for whole-brain connectivity. Why is that? The closest anyone has come has been limited to cortical connectivity diagrams (Felleman and van Essen (1991), Malcolm Young, Kotter et al, etc), and in those cases, the connectivity data was either outdated, incomplete, or both.


I have recently noticed whole-brain connectivity diagrams at BrainMaps.org, and although it still appears to be a work in progress, the results thus far seem fairly impressive. It remains to be seen whether the graphing methods they are employing will scale to deal with hundreds of nodes with thousands of edges.


UPDATE!!! Interactive visualization of brain connectivity in 3D! According to the Download Page:
Welcome to nodes3D, a 3D graph visualization program written by Issac Trotts in consultation with Shawn Mikula, in the labs of Edward G. Jones. On startup, nodes3d will download a graph of gross neuroanatomical connectivity from the MySQL database at brainmaps.org. Also supports loading of graphs from files or other databases.


Very Cool!

Saturday, June 17, 2006

Open Challenge to Microsoft, Google, and Yahoo! Developers

Ok, geospatial mapping services are great and all, but come on, mapping the brain is far more interesting and needed. So I offer an open challenge to Microsoft, Google, and Yahoo! developers who are involved with these AJAX and Flash-related mapping technologies to consider developing them for other fields besides mapping the earth. Try applying your talents to mapping the brain, which is truly the last frontier.

Friday, May 19, 2006

Neural Science: A Century of Progress and the Mysteries that Remain

Thomas D. Albright, Thomas M. Jessell, Eric R. Kandel, and Michael I. Posner

full PDF, full HTML

The goal of neural science is to understand the biological mechanisms that account for mental activity. Neural science seeks to understand how the neural circuits that are assembled during development permit individuals to perceive the world around them, how they recall that perception from memory, and, once recalled, how they can act on the memory of that perception. Neural science also seeks to understand the biological underpinnings of our emotional life, how emotions color our thinking and how the regulation of emotion, thought, and action goes awry in diseases such as depression, mania, schizophrenia, and Alzheimer's disease. These are enormously complex problems, more complex than any we have confronted previously in other areas of biology.

Historically, neural scientists have taken one of two approaches to these complex problems: reductionist or holistic. Reductionist, or bottom–up, approaches attempt to analyze the nervous system in terms of its elementary components, by examining one molecule, one cell, or one circuit at a time. These approaches have converged on the signaling properties of nerve cells and used the nerve cell as a vantage point for examining how neurons communicate with one another, and for determining how their patterns of interconnections are assembled during development and how they are modified by experience. Holistic, or top–down approaches, focus on mental functions in alert behaving human beings and in intact experimentally accessible animals and attempt to relate these behaviors to the higher-order features of large systems of neurons. Both approaches have limitations but both have had important successes.

The holistic approach had its first success in the middle of the nineteenth century with the analysis of the behavioral consequences following selective lesions of the brain. Using this approach, clinical neurologists, led by the pioneering efforts of Paul Pierre Broca, discovered that different regions of the cerebral cortex of the human brain are not functionally equivalent ([271 and 266]). Lesions to different brain regions produce defects in distinctively different aspects of cognitive function. Some lesions interfere with comprehension of language, other with the expression of language; still other lesions interfere with the perception of visual motion or of shape, with the storage of long-term memories, or with voluntary action. In the largest sense, these studies revealed that all mental processes, no matter how complex, derive from the brain and that the key to understanding any given mental process resides in understanding how coordinated signaling in interconnected brain regions gives rise to behavior. Thus, one consequence of this top–down analysis has been initial demystification of aspects of mental function: of language perception, action, learning, and memory ( [164]).

A second consequence of the top–down approach came at the beginning of the twentieth century with the work of the Gestalt psychologists, the forerunners of cognitive psychologists. They made us realize that percepts, such as those which arise from viewing a visual scene, cannot simply be dissected into a set of independent sensory elements such as size, color, brightness, movement, and shape. Rather, the Gestaltists found that the whole of perception is more than the sum of its parts examined in isolation. How one perceives an aspect of an image, its shape or color, for example, is in part determined by the context in which that image is perceived. Thus, the Gestaltists made us appreciate that to understand perception we needed not only to understand the physical properties of the elements that are perceived, but more importantly, to understand how the brain reconstructs the external world in order to create a coherent and consistent internal representation of that world.

With the advent of brain imaging, the holistic methods available to the nineteenth century clinical neurologist, based mostly on the detailed study of neurological patients with defined brain lesions, were enhanced dramatically by the ability to examine cognitive functions in intact behaving normal human subjects ([243]). By combining modern cognitive psychology with high-resolution brain imaging, we are now entering an era when it may be possible to address directly the higher-order functions of the brain in normal subjects and to study in detail the nature of internal representations.

The success of the reductionist approach became fully evident only in the twentieth century with the analysis of the signaling systems of the brain. Through this approach, we have learned the molecular mechanisms through which individual nerve cells generate their characteristic long-range signals as all-or-none action potentials and how nerve cells communicate through specific connections by means of synaptic transmission. From these cellular studies, we have learned of the remarkable conservation of both the long-range and the synaptic signaling properties of neurons in various parts of the vertebrate brain, indeed in the nervous systems of all animals. What distinguishes one brain region from another and the brain of one species from the next, is not so much the signaling molecules of their constituent nerve cells, but the number of nerve cells and the way they are interconnected. We have also learned from studies of single cells how sensory stimuli are sorted out and transformed at various relays and how these relays contribute to perception. Much as predicted by the Gestalt psychologists, these cellular studies have shown us that the brain does not simply replicate the reality of the outside world, but begins at the very first stages of sensory transduction to abstract and restructure external reality.

In this review we outline the accomplishments and limitations of these two approaches in attempts to delineate the problems that still confront neural science. We first consider the major scientific insights that have helped delineate signaling in nerve cells and that have placed that signaling in the broader context of modern cell and molecular biology. We then go on to consider how nerve cells acquire their identity, how they send axons to specific targets, and how they form precise patterns of connectivity. We also examine the extension of reductionist approaches to the visual system in an attempt to understand how the neural circuitry of visual processing can account for elementary aspects of visual perception. Finally, we turn from reductionist to holistic approaches to mental function. In the process, we confront some of the enormous problems in the biology of mental functioning that remain elusive, problems in the biology of mental functioning that have remained completely mysterious. How does signaling activity in different regions of the visual system permit us to perceive discrete objects in the visual world? How do we recognize a face? How do we become aware of that perception? How do we reconstruct that face at will, in our imagination, at a later time and in the absence of ongoing visual input? What are the biological underpinnings of our acts of will?

As the discussions below attempt to make clear, the issue is no longer whether further progress can be made in understanding cognition in the twenty-first century. We clearly will be able to do so. Rather, the issue is whether we can succeed in developing new strategies for combining reductionist and holistic approaches in order to provide a meaningful bridge between molecular mechanism and mental processes: a true molecular biology of cognition. If this approach is successful in the twenty-first century, we may have a new, unified, and intellectually satisfying view of mental processes.

Sunday, April 16, 2006

Whither to Neuroinformatics?

“We are alarmed that the NIH
has chosen to poorly support
neuroinformatics under
the NIH Roadmap and Neuroscience
Blueprint initiatives.”
—Gazzaniga et al, Jan 2006.

Is this a sign that neuroinformatics funding is in trouble? If so, what can be done about it?

Granted, the "Decade of the Brain" (1990-2000) was not exactly a stunning success. Just compare it alongside the Human Genome Project's online and offline success to see how far behind neuroscience fell. But this does not necessarily justify the cutback in funding. There are excellent initiatives that have recently emerged. What we need to do is redirect the funding to those initiatives that have a high probability for success, and that have already evinced success. Those initiatives do exist: For example, fMRIdc.org and BrainMaps.org, to name a couple.

Collaborative Digital Brain Mapping Comes of Age

Google Maps and related geomapping services provide high-resolution satellite maps to anyone with an internet connection and have set the standard for online digital mapping. We are now beginning to witness similar digital mapping technologies spilling over into other non-related fields, one of the more interesting of which is neuroscience and the collaborative digital mapping of the brain.

Launched less than a year ago, BrainMaps.org has rapidly developed to lead the field in digital brain mapping technologies. With several terabytes of ultra high-resolution brain image data, consisting of several dozen mouse, monkey, and human brains, its online brain image database is the largest and most diverse currently available. This massive image data is integrated with structural information regarding spatial locations of different brain areas and markers, and the relations between them. And in the collaborative spirit, online users are free to add their own labels and annotations, and to place landmarks throughout the digital brains they explore. Users may even share their images, landmarks, and other annotations with other users in the BrainMaps forum, which in many ways parallels the Google Maps Community, but on a smaller scale.

The U.S.-sponsored 'Decade of the Brain' has come and gone; it officially ended in the year 2000. It would take another five years before BrainMaps.org came onto the scene, and in a way, it encapulates what the Decade of the Brain should have been about: Collaborative digital brain mapping and a resource available to everyone with an internet connection.

Labels: ,

The Decade of Reverse Engineering the Brain (2005 - 2015)

We are witnessing a renaissance in brain science and technology. Science is examining the brain in ever increasing detail to discern important components of brain structure and function, all of it leading to a reverse engineering of the brain. Within the last year alone, websites have appeared devoted to mapping the brain in high detail. One of the most stunning of these is BrainMaps.org, where visitors may explore high resolution images of whole human and primate brains, seeing every neuron and every neuron process in vivid detail. We are now at a unique point in history where the brain is no longer viewed as a 'black box', but now, anyone with an internet connection can view every single detail of brain structure online. We are post-'Decade of the Brain' (1990-2000). We are entering the 'Decade of Reverse Engineering the Brain'.